Forward Modeling of an Emission Spectrum with Many Lines (MODIT)
Septempber 3rd (2021) Hajime Kawahara
We try to compute an emission spectrum in which many methane lines exist. This situation mocks a T-type brown dwarf. The spectrum computed in this section will be used in “Reverse Modeling of an Emission Spectrum with Many Lines (MODIT)”.
from exojax.spec import rtransfer as rt
from exojax.spec import dit, modit
#ATMOSPHERE
NP=100
T0=1295.0 #K
Parr, dParr, k=rt.pressure_layer(NP=NP)
Tarr = T0*(Parr)**0.1
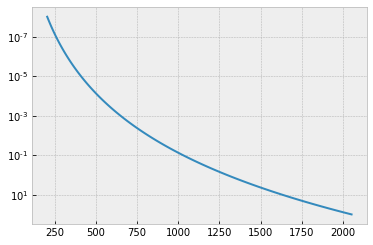
A T-P profile we assume is here.
import matplotlib.pyplot as plt
plt.style.use('bmh')
plt.plot(Tarr,Parr)
plt.yscale("log")
plt.gca().invert_yaxis()
plt.show()

We set a wavenumber grid using nugrid. Specify xsmode=“modit” though it is not mandatory. MODIT uses FFT, so the (internal) wavenumber grid should be evenly spaced in log.
from exojax.spec.rtransfer import nugrid
nus,wav,R=nugrid(16360,16560,10000,unit="AA",xsmode="modit")
nugrid is log: mode= modit
Loading a molecular database of CH4 and CIA (H2-H2)…
from exojax.spec import moldb, contdb
mdbCH4=moldb.MdbExomol('.database/CH4/12C-1H4/YT10to10/',nus,crit=1.e-30)
cdbH2H2=contdb.CdbCIA('.database/H2-H2_2011.cia',nus)
Background atmosphere:  H2
Reading transition file
.broad is used.
Broadening code level= a1
default broadening parameters are used for  12  J lower states in  29  states
H2-H2
We have 140031 lines
len(mdbCH4.A)
140031
from exojax.spec import molinfo
molmassCH4=molinfo.molmass("CH4")
Computing the relative partition function,
from jax import vmap
qt=vmap(mdbCH4.qr_interp)(Tarr)
Pressure and Natural broadenings
from jax import jit
from exojax.spec.exomol import gamma_exomol
from exojax.spec import gamma_natural

gammaLMP = jit(vmap(gamma_exomol,(0,0,None,None)))\
        (Parr,Tarr,mdbCH4.n_Texp,mdbCH4.alpha_ref)
gammaLMN=gamma_natural(mdbCH4.A)
gammaLM=gammaLMP+gammaLMN[None,:]
And line strength
from exojax.spec import SijT
SijM=jit(vmap(SijT,(0,None,None,None,0)))\
    (Tarr,mdbCH4.logsij0,mdbCH4.nu_lines,mdbCH4.elower,qt)
MODIT uses the normalized quantities by wavenumber/R, where R is the spectral resolution. In this case, the normalized Doppler width (nsigmaD) is common for the same isotope. Then, we use a 2D DIT grid with the normalized gammaL and q = R log(nu).
from exojax.spec import normalized_doppler_sigma
import numpy as np
nsigmaDl=normalized_doppler_sigma(Tarr,molmassCH4,R)[:,np.newaxis]
dv_lines=mdbCH4.nu_lines/R
ngammaLM=gammaLM/dv_lines
MODIT uses a grid of ngammaL and wavenumber. dgmatrix makes a 1D grid for ngamma for n-th layers.
dgm_ngammaL=modit.dgmatrix(ngammaLM,0.2)
#show the DIT grids
from exojax.plot.ditplot import plot_dgmn
plot_dgmn(Parr,dgm_ngammaL,ngammaLM,0,6)

We need to precompute the contribution for wavenumber and pmarray. These can be computed using init_dit.
from exojax.spec import initspec
cnu,indexnu,R,pmarray=initspec.init_modit(mdbCH4.nu_lines,nus)
Let’s compute a cross section matrix using modit.xsmatrix.
xsm=modit.xsmatrix(cnu,indexnu,R,pmarray,nsigmaDl,ngammaLM,SijM,nus,dgm_ngammaL)
import numpy as np
fig=plt.figure(figsize=(20,4))
ax=fig.add_subplot(111)
c=plt.imshow(np.log10(xsm),cmap="bone_r",vmin=-23,vmax=-19)
plt.colorbar(c,shrink=0.8)
plt.text(50,30,"MODIT")
ax.set_aspect(0.2/ax.get_data_ratio())
plt.show()
/tmp/ipykernel_41828/2860296713.py:4: RuntimeWarning: divide by zero encountered in log10
  c=plt.imshow(np.log10(xsm),cmap="bone_r",vmin=-23,vmax=-19)
/tmp/ipykernel_41828/2860296713.py:4: RuntimeWarning: invalid value encountered in log10
  c=plt.imshow(np.log10(xsm),cmap="bone_r",vmin=-23,vmax=-19)

Sometimes, xsm includes negative elements due to error. Check it.
len(xsm[xsm<0.0]), np.min(xsm)
(4552, DeviceArray(-1.1067153e-22, dtype=float32))
This negative value is very small. For instance, jnp.abs can remove it.
import jax.numpy as jnp
xsm=jnp.abs(xsm)
computing delta tau for CH4
from exojax.spec.rtransfer import dtauM
import jax.numpy as jnp
Rp=0.88
Mp=33.2
g=2478.57730044555*Mp/Rp**2 #gravity cm/s2
MMR=0.0059 #mass mixing ratio
dtaum=dtauM(dParr,xsm,MMR*np.ones_like(Tarr),molmassCH4,g)
computing delta tau for CIA
from exojax.spec.rtransfer import dtauCIA
mmw=2.33 #mean molecular weight
mmrH2=0.74
molmassH2=molinfo.molmass("H2")
vmrH2=(mmrH2*mmw/molmassH2) #VMR
dtaucH2H2=dtauCIA(nus,Tarr,Parr,dParr,vmrH2,vmrH2,\
            mmw,g,cdbH2H2.nucia,cdbH2H2.tcia,cdbH2H2.logac)
The total delta tau is a summation of them
dtau=dtaum+dtaucH2H2
you can plot a contribution function using plot.atmplot.
from exojax.plot.atmplot import plotcf
plotcf(nus,dtau,Tarr,Parr,dParr)
plt.show()

radiative transfering…
from exojax.spec import planck
from exojax.spec.rtransfer import rtrun
sourcef = planck.piBarr(Tarr,nus)
F0=rtrun(dtau,sourcef)
fig=plt.figure(figsize=(20,4))
ax=fig.add_subplot(211)
plt.plot(wav[::-1],F0,lw=1,label="DIT")
plt.legend()
plt.xlabel("wavelength ($\AA$)")
plt.savefig("ch4.png")

MODIT uses ESLOG as the wavenunmber grid. We can directly apply the response to the raw spectrum.
from exojax.spec import response
from exojax.utils.constants import c
import jax.numpy as jnp

wavd=jnp.linspace(16360,16560,1500) #observational wavelength grid
nusd = 1.e8/wavd[::-1]

RV=10.0 #RV km/s
vsini=20.0 #Vsini km/s
u1=0.0 #limb darkening u1
u2=0.0 #limb darkening u2

Rinst=100000. #spectral resolution of the spectrograph
beta=c/(2.0*np.sqrt(2.0*np.log(2.0))*Rinst) #IP sigma (STD of Gaussian)

Frot=response.rigidrot(nus,F0,vsini,u1,u2)
F=response.ipgauss_sampling(nusd,nus,Frot,beta,RV)
fig=plt.figure(figsize=(20,4))
plt.plot(wav[::-1],F0,alpha=0.5)
plt.plot(wavd[::-1],F)
plt.xlabel("wavelength ($\AA$)")
plt.savefig("moditCH4.png")

Let’s save the spectrum for the retrieval.
np.savetxt("spectrum_ch4.txt",np.array([wavd,F]).T,delimiter=",")