Ackerman and Marley Cloud Model
Sep 6 (2021) Hajime Kawahara
Here, we try to compute a cloud opacity using Ackerman and Marley Model. We consider enstatite (MgSiO3) and Fe clouds.
from exojax.atm import amclouds
import jax.numpy as jnp
import matplotlib.pyplot as plt
import numpy as np
Setting a simple atmopheric model. We need the density of atmosphere.
from exojax.spec import rtransfer as rt
from exojax.utils.constants import kB,m_u

NP=100
Parr, dParr, k=rt.pressure_layer(NP=NP,logPtop=-8.,logPbtm=4.0)
alpha=0.097
T0=1200.
Tarr=T0*(Parr)**alpha

mu=2.0 # mean molecular weight
R=kB/(mu*m_u)
rho=Parr/(R*Tarr)
The solar abundance can be obtained using utils.zsol.nsol. Here, we assume a maximum VMR for MgSiO3 and Fe from solar abundance.
from exojax.utils.zsol import nsol
n=nsol() #solar abundance
VMR_enstatite=np.min([n["Mg"],n["Si"],n["O"]/3])
VMR_Fe=n["Fe"]
Vapor saturation pressures can be obtained using atm.psat
from exojax.atm.psat import Psat_enstatite_AM01, Psat_Fe_solid
P_enstatite=Psat_enstatite_AM01(Tarr)
P_fe_sol=Psat_Fe_solid(Tarr)
Compute a cloud base pressure.
from exojax.atm.amclouds import get_Pbase
Pbase_enstatite=get_Pbase(Parr,P_enstatite,VMR_enstatite)
Pbase_Fe_sol=get_Pbase(Parr,P_fe_sol,VMR_Fe)
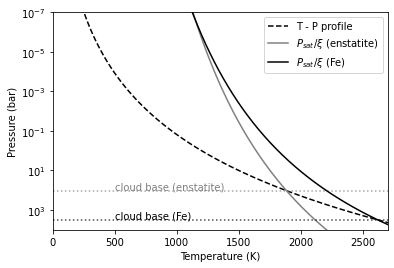
The cloud base is located at the intersection of a TP profile and the vapor saturation puressure devided by VMR.
import matplotlib.pyplot as plt
plt.plot(Tarr,Parr,color="black",ls="dashed",label="T - P profile")
plt.plot(Tarr,P_enstatite/VMR_enstatite,label="$P_{sat}/\\xi$ (enstatite)",color="gray")
plt.axhline(Pbase_enstatite,color="gray",alpha=0.7,ls="dotted")
plt.text(500,Pbase_enstatite*0.8,"cloud base (enstatite)",color="gray")

plt.plot(Tarr,P_fe_sol/VMR_Fe,label="$P_{sat}/\\xi$ (Fe)",color="black")
plt.axhline(Pbase_Fe_sol,color="black",alpha=0.7,ls="dotted")
plt.text(500,Pbase_Fe_sol*0.8,"cloud base (Fe)",color="black")

plt.yscale("log")
plt.ylim(1.e-7,10000)
plt.xlim(0,2700)
plt.gca().invert_yaxis()
plt.legend()
plt.xlabel("Temperature (K)")
plt.ylabel("Pressure (bar)")
plt.savefig("pbase.pdf", bbox_inches="tight", pad_inches=0.0)
plt.savefig("pbase.png", bbox_inches="tight", pad_inches=0.0)
plt.show()

Compute VMRs of clouds. Because Parr is an array, we apply jax.vmap to atm.amclouds.VMRclouds.
from jax import vmap
from exojax.atm.amclouds import VMRcloud

get_VMRc=vmap(VMRcloud,(0,None,None,None),0)

fsed=3
VMRbase_enstatite=VMR_enstatite
VMRc_enstatite=get_VMRc(Parr,Pbase_enstatite,fsed,VMR_enstatite)

VMRbase_Fe=VMR_Fe
VMRc_Fe=get_VMRc(Parr,Pbase_Fe_sol,fsed,VMR_Fe)
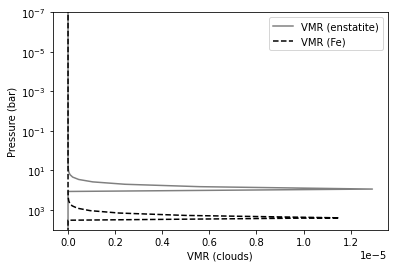
Here is the VMR distribution.
import seaborn as sns
import matplotlib.pyplot as plt

plt.figure()
plt.gca().get_xaxis().get_major_formatter().set_powerlimits([-3,3])
plt.plot(VMRc_enstatite,Parr,color="gray",label="VMR (enstatite)")
plt.plot(VMRc_Fe,Parr,color="black",ls="dashed",label="VMR (Fe)")

plt.yscale("log")
plt.ylim(1.e-7,10000)
plt.gca().invert_yaxis()
plt.legend()
plt.xlabel("VMR (clouds)")
plt.ylabel("Pressure (bar)")
plt.savefig("vmrcloud.pdf", bbox_inches="tight", pad_inches=0.0)
plt.savefig("vmrcloud.png", bbox_inches="tight", pad_inches=0.0)
plt.show()

Compute dynamic viscosity in H2 atmosphere (cm/g/s)
from exojax.atm.viscosity import eta_Rosner,calc_vfactor
T=np.logspace(np.log10(1000),np.log10(2000))
vfactor,Tr=calc_vfactor("H2")
eta=eta_Rosner(T,vfactor)
plt.plot(T,eta)
plt.xscale("log")
plt.yscale("log")
plt.xlabel("Temperature (K)")
plt.ylabel("Dynamic viscosity (cm/g/s)")
plt.show()

The pressure scale height can be computed using atm.atmprof.Hatm.
from exojax.atm.atmprof import Hatm
T=1000 #K
mu=2 #mean molecular weight
print("scale height=",Hatm(1.e5,T,mu),"cm")
scale height= 415722.9931793715 cm
We need a density of condensates.
rhoc_enstatite=3.192 #g/cm3 Lodders and Fegley (1998)
rhoc_Fe=7.875

from exojax.spec.molinfo import molmass
mu=molmass("H2")
muc_enstatite=molmass("MgSiO3")
muc_Fe=molmass("Fe")
Let’s compute the terminal velocity. We can compute the terminalvelocity of cloud particle using atm.vterm.vf. See “Terminal Velocity of Cloud Particles” in the userguide for the details. vmap is again applied to vf.
from exojax.atm.viscosity import calc_vfactor, eta_Rosner
from exojax.atm.vterm import vf
from jax import vmap

vfactor, trange=calc_vfactor(atm="H2")
rarr=jnp.logspace(-6,-4,2000) #cm
drho=rhoc_enstatite-rho
eta_fid=eta_Rosner(Tarr,vfactor)

g=1.e5
vf_vmap=vmap(vf,(None,None,0,0,0))
vfs=vf_vmap(rarr,g,eta_fid,drho,rho)
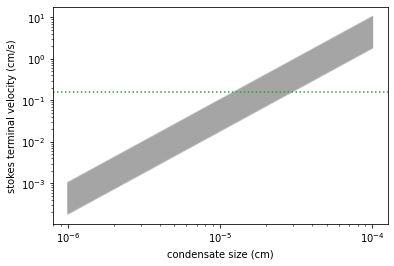
Kzz/L will be used to calibrate \(r_w\). following Ackerman and Marley 2001
Kzz=1.e5 #cm2/s
sigmag=2.0
alphav=1.3
L=Hatm(g,1500,mu)
Kzz/L
0.16163647693888086
for i in range(0,len(Tarr)):
    plt.plot(rarr,vfs[i,:],alpha=0.2,color="gray")
plt.xscale("log")
plt.yscale("log")
plt.axhline(Kzz/L,label="Kzz/H",color="C2",ls="dotted")
plt.ylabel("stokes terminal velocity (cm/s)")
plt.xlabel("condensate size (cm)")
Text(0.5, 0, 'condensate size (cm)')

Find the intersection.
from exojax.atm.amclouds import find_rw
vfind_rw=vmap(find_rw,(None,0,None),0)
rw=vfind_rw(rarr,vfs,Kzz/L)
Then, \(r_g\) can be computed from \(r_w\) and other quantities.
from exojax.atm.amclouds import get_rg
rg=get_rg(rw,fsed,alphav,sigmag)
plt.plot(rg*1.e4,Parr,label="$r=r_g$",color="black")
plt.plot(rw*1.e4,Parr,ls="dashed",label="$r=r_w$",color="black")
plt.ylim(1.e-7,10000)
plt.xlabel("$r$ (micron)")
plt.ylabel("Pressure (bar)")
plt.yscale("log")
plt.savefig("rgrw.png")
plt.legend()
<matplotlib.legend.Legend at 0x7f82142a7f40>

We found here the particle size is basically sub-micron. So, we should use the Rayleigh scattering. But, here, we try to use the geometric cross section instead though this is wrong.
Warning
The following lines will be updated using the Rayleigh scattering. This is just a test.
from exojax.atm.amclouds import dtau_cloudgeo

dtau_enstatite=dtau_cloudgeo(Parr,muc_enstatite,rhoc_enstatite,mu,VMRc_enstatite,rg,sigmag,g)
dtau_Fe=dtau_cloudgeo(Parr,muc_Fe,rhoc_Fe,mu,VMRc_Fe,rg,sigmag,g)
plt.plot(dtau_enstatite,Parr,color="C1")
plt.plot(dtau_Fe,Parr,color="C2",ls="dashed")
plt.yscale("log")
plt.ylim(1.e-7,10000)
plt.xlabel("$d\\tau$")
plt.ylabel("Pressure (bar)")
#plt.xscale("log")
plt.gca().invert_yaxis()

Let’s compare with CIA
#CIA
from exojax.spec.rtransfer import nugrid
nus,wav,res=nugrid(9500,30000,1000,unit="AA")
from exojax.spec import contdb
cdbH2H2=contdb.CdbCIA('.database/H2-H2_2011.cia',nus)
nugrid is log: mode= lpf
WARNING: resolution may be too small. R= 868.7669794117727
H2-H2
from exojax.spec.rtransfer import dtauCIA
mmw=2.33 #mean molecular weight
mmrH2=0.74
molmassH2=molmass("H2")
vmrH2=(mmrH2*mmw/molmassH2) #VMR
dtaucH2H2=dtauCIA(nus,Tarr,Parr,dParr,vmrH2,vmrH2,\
            mmw,g,cdbH2H2.nucia,cdbH2H2.tcia,cdbH2H2.logac)
dtau=dtaucH2H2+dtau_enstatite[:,None]+dtau_Fe[:,None]
from exojax.plot.atmplot import plotcf
plotcf(nus,dtau,Tarr,Parr,dParr,unit="nm")
plt.show()

from exojax.plot.atmplot import plotcf
plotcf(nus,dtaucH2H2,Tarr,Parr,dParr,unit="AA")
plt.show()

from exojax.plot.atmplot import plotcf
plotcf(nus,dtau_enstatite[:,None]+np.zeros_like(dtaucH2H2),Tarr,Parr,dParr,unit="AA")
plt.show()

from exojax.spec import planck
from exojax.spec.rtransfer import rtrun
sourcef = planck.piBarr(Tarr,nus)
F0=rtrun(dtau,sourcef)
F0CIA=rtrun(dtaucH2H2,sourcef)
F0cl=rtrun(dtau_enstatite[:,None]+np.zeros_like(dtaucH2H2),sourcef)
plt.plot(wav[::-1],F0,label="Clouds+CIA")
plt.plot(wav[::-1],F0CIA,label="CIA only",ls="dashed")
plt.plot(wav[::-1],F0cl,label="Clouds only",ls="dotted")
plt.xlabel("wavelenght AA")
plt.legend()
plt.show()
