CIA coefficient
Collisional Induced Absorption (CIA) refers to the phenomenon where temporary interactions between molecules during collisions induce a transient dipole moment, enabling the absorption of radiation that would not occur in isolated molecules. This mechanism is particularly significant in environments with non-polar molecules, such as H22 and He, where typical dipole-induced transitions are absent.
In the context of planetary and brown dwarf atmospheres, CIA is
particularly important as a source of continuum opacity in the spectra
of hydrogen-rich gas planets. In ExoJAX, the CdbCIA class can be
used for database I/O to access CIA data provided by HITRAN.
For examples of actual usage, please refer to resources such as the get started guide.
from exojax.utils.grids import wavenumber_grid

nu_grid, wav, res = wavenumber_grid(5000, 50000, 1000, unit="AA", xsmode="lpf")

from exojax.database import contdb
cdbH2H2 = contdb.CdbCIA(".database/H2-H2_2011.cia", nu_grid)
xsmode =  lpf
xsmode assumes ESLOG in wavenumber space: xsmode=lpf
======================================================================
The wavenumber grid should be in ascending order.
The users can specify the order of the wavelength grid by themselves.
Your wavelength grid is in *  descending  * order
======================================================================
H2-H2
For opacity calculations, the OpaCIA class is available.
from exojax.opacity import OpaCIA
opacia = OpaCIA(cdbH2H2, nu_grid=nu_grid)
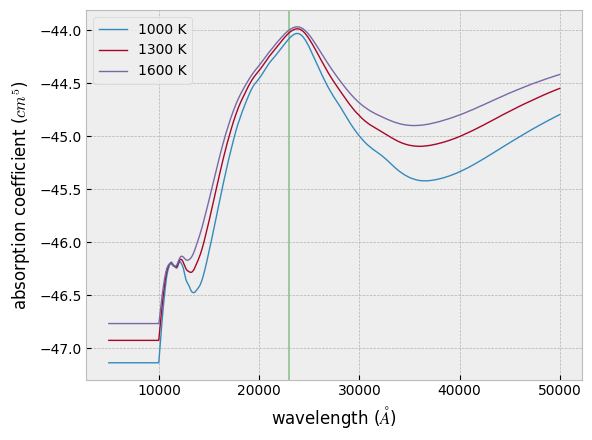
Let’s calculate (the logarithm of) the CIA absorption coefficient at
three different temperatures. To compute them all at once, you can use
opa.logacia_matrix. (If you want to calculate it for a single
temperature, you can use opa.logacia_vector instead.)
import jax.numpy as jnp
Tfix = jnp.array([1000.0, 1300.0, 1600.0])

lc = opacia.logacia_matrix(Tfix)
import matplotlib.pyplot as plt

plt.style.use("bmh")
for i in range(0, len(Tfix)):
    plt.plot(wav, lc[i, :], lw=1, label=str(int(Tfix[i])) + " K")
plt.axvspan(22876.0, 23010.0, alpha=0.3, color="green")
plt.xlabel("wavelength ($\\AA$)")
plt.ylabel("absorption coefficient ($cm^5$)")
plt.legend()
plt.savefig("cia.png")
In practice, this simply performs interpolation within the CIA database
grid. cdb.tcia contains the temperature axis, cdb.nucia holds
the wavenumber values, and cdb.logac stores the logarithmic
absorption coefficients.
from exojax.database.core.abscoeff import interp_logacia_vector
lc = interp_logacia_vector(Tfix, nu_grid, cdbH2H2.nucia, cdbH2H2.tcia, cdbH2H2.logac).T